
Grafana
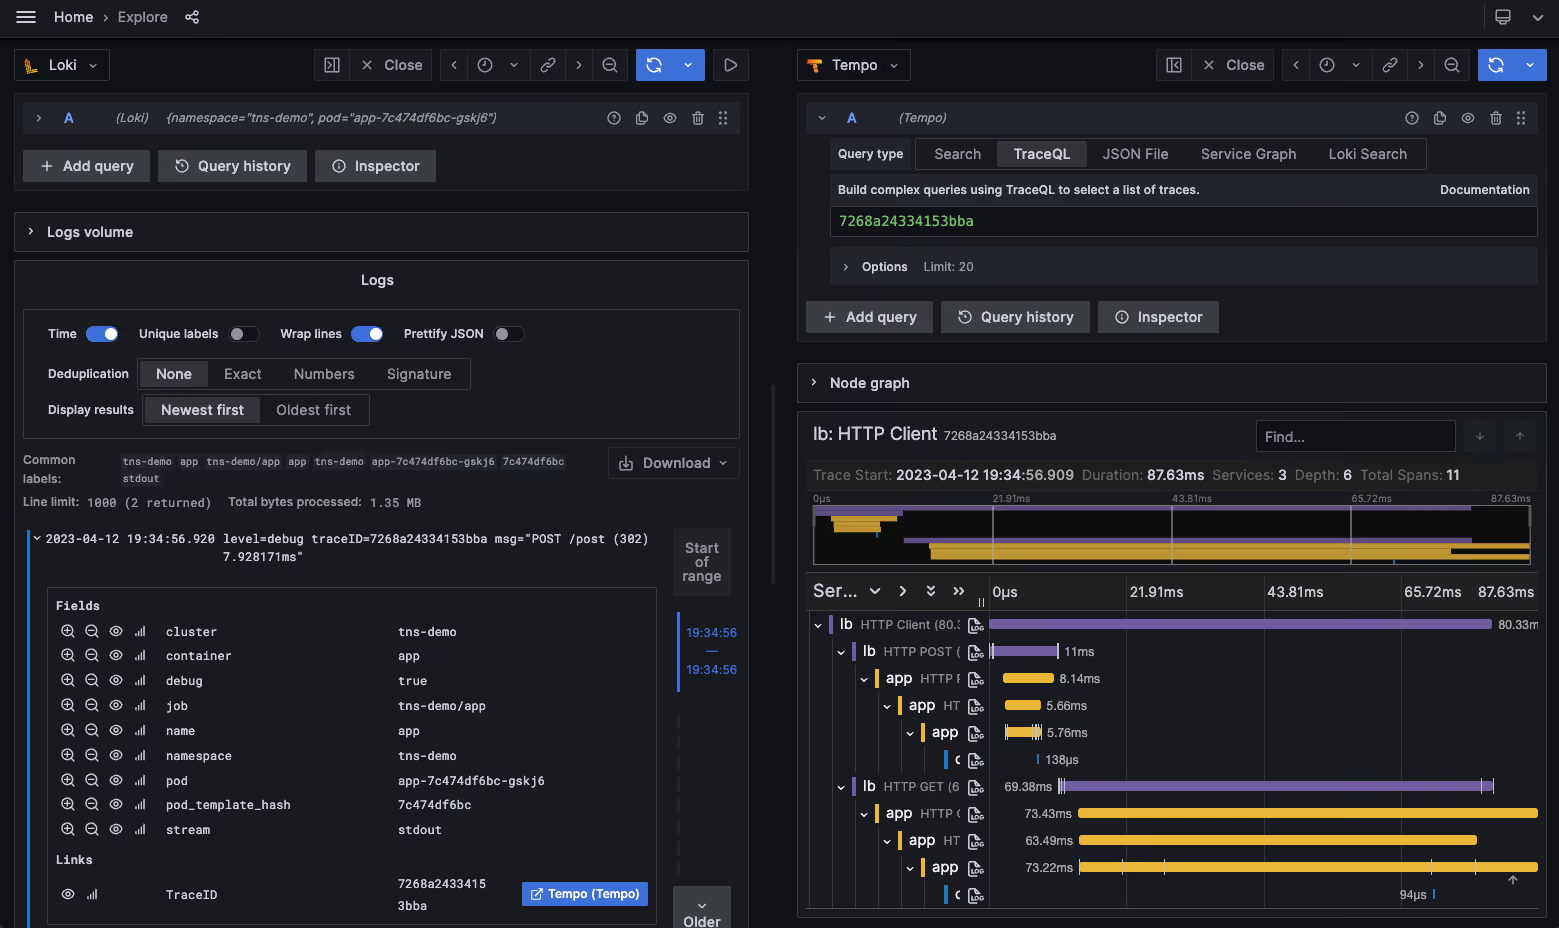
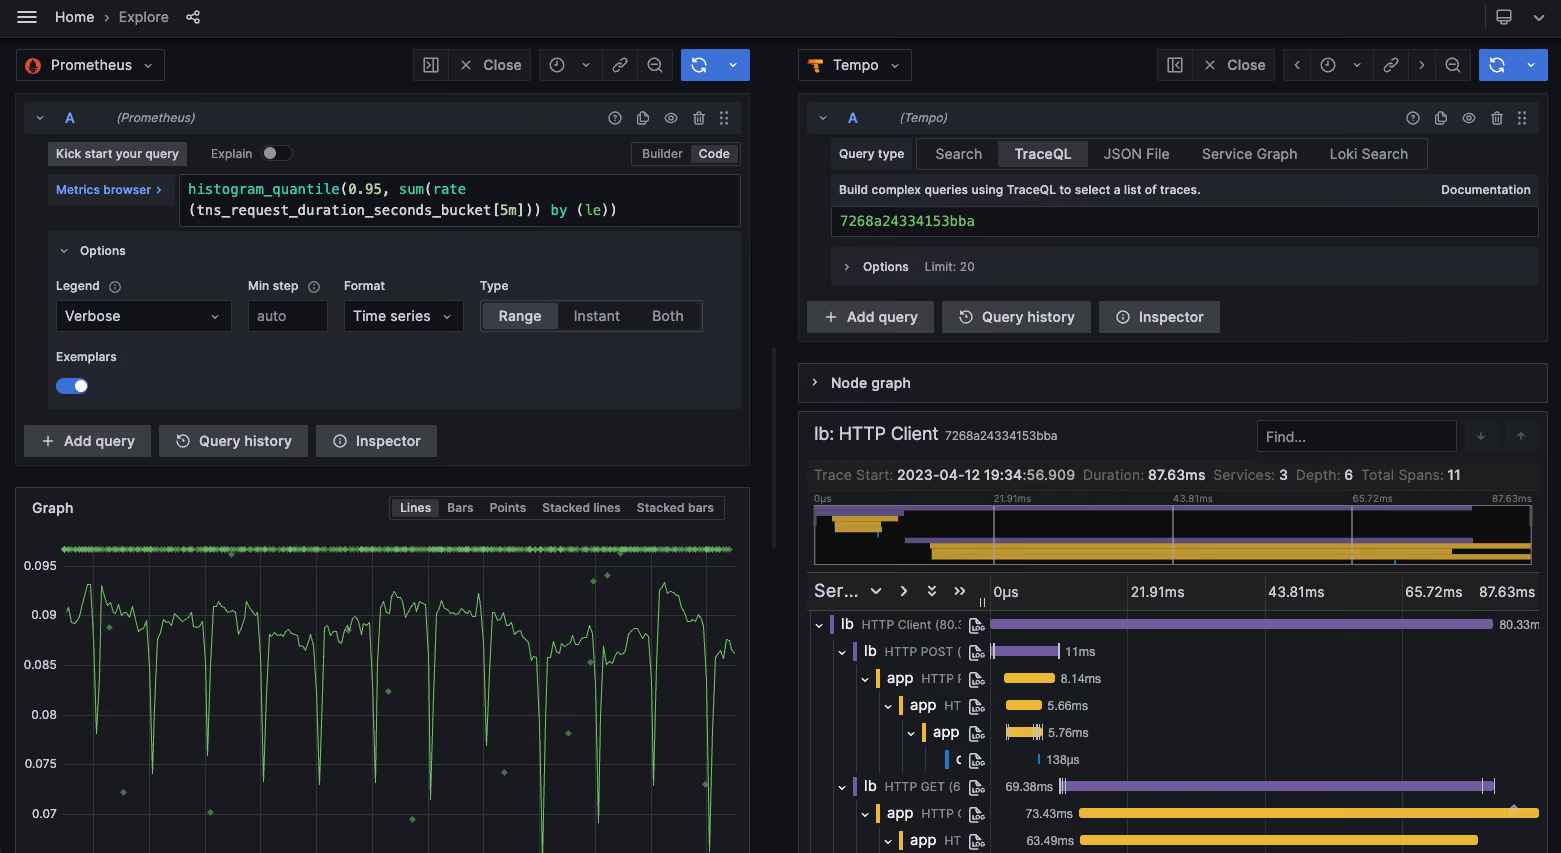
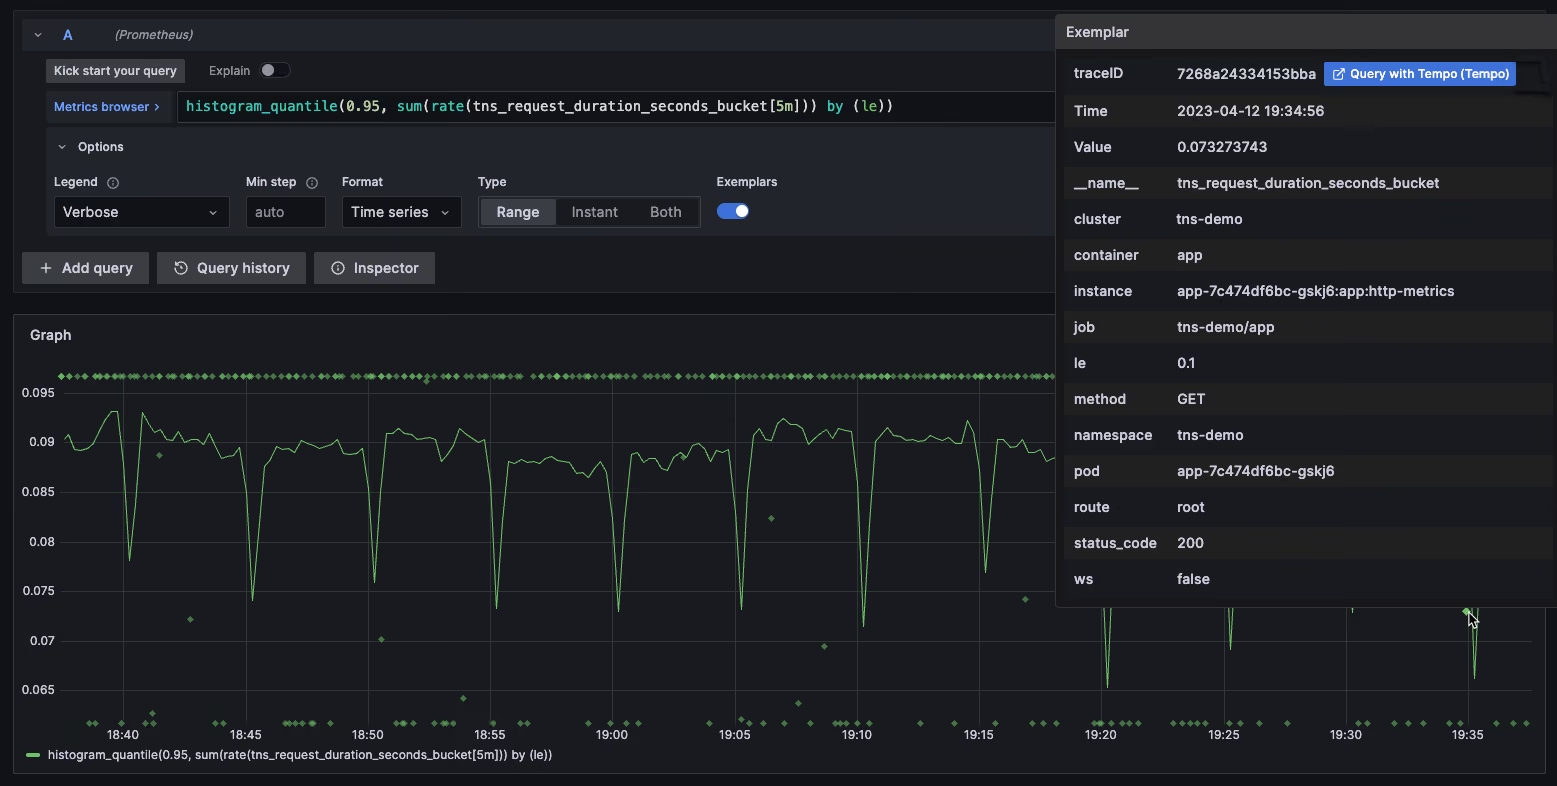
Grafana is an open-source analytics and visualization web application. It connects to time series databases and other data sources, allowing users to build dashboards that display metrics, logs, and traces.
- Centralised view of logs from every Ozone service in one place
- Fast log search and filtering by service, container, level or time range (with Loki)
- Dashboards for system health: uptime, errors, response times, resource usage
- Alerting on thresholds or log patterns, sent to email, Slack, Teams and other channels
- Mix data sources in one dashboard (Loki, Prometheus, MySQL, PostgreSQL and more)
- Shareable dashboards, folders and role-based permissions
- Large library of community dashboards and plugins
Grafana is developed by Grafana Labs, a company headquartered in New York with a largely remote team, together with a large open-source community. The core product is released under the AGPLv3 licence, with frequent releases on GitHub. Grafana Labs also builds the companion Loki (logs) and Grafana Agent/Alloy (collection) projects that Ozone uses, and funds development through Grafana Cloud and enterprise offerings.
- In Ozone, Grafana is the front end of the centralised logging stack: Grafana Agent collects container logs, Loki stores them, Grafana displays them. All three services must be running.
- Logging is for operations and support, not clinical reporting; use Superset for health-data dashboards.
- Size Loki's storage and set a log retention period; logs grow quickly on busy sites.
- Logs can contain patient identifiers or other sensitive data, so restrict Grafana access to system administrators.
- Grafana and Loki share a dedicated Docker network in Ozone; keep that network in custom compose overrides.